Topic Overview

Introduction to and Overview of Lidar

Reposted with permission

NOTE: The formatting has been changed to fit the style of this site.

Introduction

Lidar (LiDAR, LIDAR and Lidar are all acceptable) is a remote sensing technology that lets a sensor platform quickly gather high-precision spatial data. The term Lidar often refers to the physical sensors but can also be used to refer to the data produced by the sensors or the software used to process the sensor data.

Physically, Lidar sensors work by sending out a pulse of light (usually from a laser) in a known direction and then recording the returns from that pulse before moving the mirror to a new direction and firing another pulse. The timings of the returned pulses measures the distance from the sensor which can be combined with the known direction of the pulse to identify a single point in 3D space for each measured return. In short range systems, the emitter and detector portions can be decoupled such that scans are almost constantly taking place. Figure 1 shows how such a system might work and gives one visualization for the kind of data that is returned. Different laser frequencies and detectors can be used to tune the system to be better able to image the shape of clouds, scan bottoms of riverbeds or detect fast moving objects. Recently, Lidar sensors have found a home on self-driving cars, but are also commonly used on airplanes, helicopters, drones and satellites.

Animation of a Simplified Scanning Lidar System

Figure 1 - Lidar System Overview

Lidar software generally deals with understanding, manipulating, and transforming the 3D points found by the hardware. There are a variety of formats in use to store the data with multiple industry standards such as DEM, DSM, LAS, LAZ and XYZ (see glossary below). The simplest formats just store three offsets from a given origin for each point in the data set. More complex formats can combine many types of geo-spatial data (photos, latitudes, longitudes, polygonal region definitions, point cloud, etc.) to provide more context.

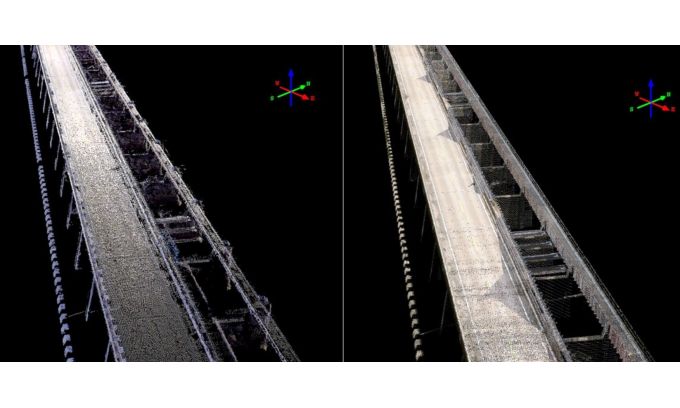
Software is needed to perform filtering on the raw point cloud data. A canonical example of this is using the same point cloud data to extract the heights and shape of the tops of the trees in a forest as well as get the underlying shape of the forest floor as seen in Figure 2.

Comparison of DSM and DTM data set extraction from same Lidar source

Figure 2 - DSM vs DTM

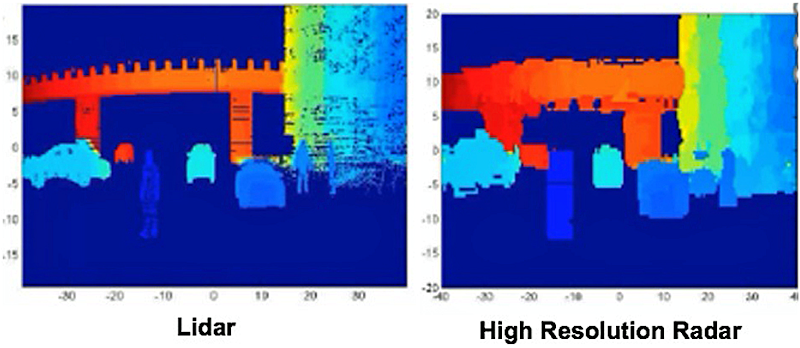
Sensor fusion refers to the art and science of combining data from multiple types of data. This is commonly done with self-driving vehicles to allow the vehicle a better understanding of the space around it. Lidar data is combined with radar returns, video images, GPS data, and other internal sensors. This data can then be used for navigation, mapping, collision avoidance, etc. A good visualization of the Lidar data generated by a self-driving car can be found on YouTube.

Background

Lidar is not the only way to perform remote sensing. Possibly the two most common competitors in the space are RADAR and Photogrammetry. According to this comparison on Lidar vs RADAR:

If your goal is to detect a car in front of you (or driving towards you) and get its velocity, the RADAR can be great. If you are trying to determine the precise location of an item, generate a surface map, or find a small fence-post, a Lidar might do better. Just remember that if you are in dust or rain the Lidar might return a cloud of points right near the sensor (as it reads all those particles/drops); while the RADAR might do much better.
Comparison of Lidar and Radar data

Figure 3 - Lidar vs Radar

Photogrammetry, on the other hand, uses high resolution pictures to take measurements of objects. This generally limits photogrammetry to daytime usage but also intrinsically includes RGB (Red Green Blue, i.e. color) information alongside the derived spatial data. The data generated via photogrammetry is only of the outer surface profile of an object (similar to the DSM generated from Lidar data). According to a comparison of Lidar and photogrammetric point clouds:

Both methods succeeded in accurately capturing the structure. The Lidar output took far less time to capture and process and provided a clean and sharp point cloud that was easy to work with.
Comparison of Lidar and Photogrammetric data

Figure 4 - Photogrammetric point cloud after cleaning (left) and Lidar point cloud (right)

Lidar systems are generally considered expensive. That may change in the future though as almost every self-driving car being developed makes use of a Lidar system. If those systems remain on self-driving cars as they enter production the increased supply and R&D will inevitably drive the price down across the board.

DI2E Implications

Lidar is currently being used my American military forces for a variety of purposes. For example, Lidar data can be used to determine the exact, as built, dimensional characteristics of roads, bridges, and runways. Bathymetric scans (i.e. Lidar mapping of lake and river bottoms) can be used for mapping safe passage though complex river deltas. Lidar scans in more active combat zones can also be useful for battlefield visualization, line of sight analysis, identifying possible locations for observation posts and communications equipment, and, of course, detailed mapping of mission areas.

Any modern autonomous vehicle is also likely to have a Lidar system on board. On commercial unmanned cars, Lidar is the standard for short range situational awareness systems.

Some specialized systems can also be used to detect and measure chemical concentrations in the air or even measure the speed and direction of dust or aerosol products in the wind.

Software & Tools

NOTE: Click on the name of the tools below for a link to their Storefront Evaluation, if any, or otherwise to the product homepage.

Geographic Information System (GIS) Analysis

These tools are all about taking point cloud data and applying it to maps and terrain.

Lidar GIS Software Tools
Name Brief Overview
Global Mapper A general purpose GIS tool with a Lidar module which adds automatic classification and data extraction as well as various ways of viewing Lidar point clouds in conjunction with standard GIS visualizations
Grass GIS This free tool is used for geospatial data management and analysis, image processing, graphics/map production, spatial modeling, and visualization. Some of the Lidar specific tools include outlier detection, edge detection, point filtering, and various kinds of surface generation.
LP360 A Lidar processing add on to ArcGIS, LP360 adds point cloud classification tools, data layers, breaklines, and other relevant tools.
Socet GXP Specializing in satellite and aerial image analysis, Socet GXP also includes Lidar specific tools for visualization, measurement, feature extraction, line of sight calculations, etc.
Arc​GIS ArcGIS specializes in visualizing, editing and analyzing geographic data in 2D and 3D. Its tools can extract related features, provide geostatistical analysis, and generate 3D models and movies of time-dependent changes. Many integrations into enterprise systems also exist (SAP, CRM, ERP, etc.).

Conversion & Compression

Lidar data files tend to be very large as they usually include millions of data points. There are also many different formats commonly in use and so these tools compress, filter and or transform the Lidar data.

Lidar Conversion & Compression Software
Name Brief Overview
FME Desktop FME Desktop primarily transforms data from one format to another but also includes many specialized tools for dealing with point cloud data. Such tools include data fusion tools which allow aerial photos to be combined with geo-located point clouds and get colorized point clouds, configurable thinning and joining tools to merge multiple point clouds together, filters to separate ground data points from buildings or power lines, and rasterization tools to turn point clouds into surface models.
lidar​2​dems The lidar2dems project is a collection open-source (FreeBSD license) command line utilities for supporting the easy creation of Digital Elevation Models (DEMs) from Lidar data. lidar2dems uses the PDAL library (and associated dependencies) for doing the actual point processing and gridding of point clouds into raster data.
Geo​Express GeoExpress can drastically reduce the size of Lidar point clouds via use of the MrSID format. Also included is the ability to create mosaics, crop images and data sets, and export data sets in various formats.
Lidar Compressor Similar to GeoExpress but lacks features not directly related to viewing and compression.

Viewers

Sometimes you just need to see what data is in a file. Tools in this category are geared for display and visualization of Lidar data with minimal processing or analysis features.

Lidar Viewing Software
Name Brief Overview
Quick Terrain Reader The Quick Terrain Reader can open pre-built digital elevation models (DEMs) and point clouds and allows users to freely move through the terrain in a fast and intuitive way. A handful of visualizations (color by intensity, height, etc.) and basic measurement tools are also included.
Fugro​Viewer FugroViewer is designed to read and display various types of raster- and vector-based geospatial datasets, including data from photogrammetric, Lidar, and IFSAR sources. Basic analysis options are also available like the ability to examine Lidar point clouds by classification, flight line, return number, or source ID.
Geo​Viewer GeoViewer can display raster, vector, Lidar, WMS and JPIP layers, MrSID formatted files, and the ISO standard JPEG 2000 format. Paid extras include the ability to change map projections and tile images during export and printing.
FUSION FUSION allows users to quickly and easily select and display subsets of large Lidar data. Command line programs provide specific analysis and data processing capabilities designed to make FUSION suitable for processing large Lidar data sets.

Point Cloud

These tools are all about point cloud processing, be they from laser scanners, photogrammetry, Lidar, or other sources.

General Point Could Software
Name Brief Description
Cloud Compare Originally designed to perform comparison between two dense 3D points clouds, Cloud Compare has been extended to be a more generic point cloud processing software by including many advanced algorithms (registration, resampling, color/normal/scalar fields handling, statistics computation, sensor management, interactive or automatic segmentation, display enhancement, etc.).
Vision Lidar Vision Lidar can visualize, process, classify, segment, animate and edit point clouds. Vision Lidar can also be integrated into AutoCAD, Civil3D, MicroStation, PowerDraft and Bricscad platforms.
Point Cloud Library (PCL) PCL is an open source C++ based library for (among other things) performing filtering, feature extraction, combining point clouds, surface creation and visualization of point cloud data.
Terra​Scan An add on to Bentley's MicroStation, TerraScan adds Lidar viewing and processing capability.
Compu​tree Computree is a C++ framework for processing 3D point clouds. Some of the available plugins include tools for ground isolation, tree detection, circularity filtering and voxelization
MARS MARS is a Windows application designed to visualize, manage, process, and analyze Lidar point cloud data.

Closing Summary

If light can interact with it, Lidar can measure it.

Typically, Lidar is used to generate three dimensional scans of objects (roads, buildings, clouds, people, etc.) by measuring the return time of laser light pulses. This means that Lidar samples are great at penetrating foliage and work in all light conditions but can be confused by dust.

Lidar has a long history of being used in geo-graphic, geo-spatial, and geo-intelligence analysis with many robust tools available in that space. There are also an increasing number of general purpose Lidar processing tools available and in development.

Glossary

Term Description
3D Point Cloud A general term for how computers represent data returned from a Lidar system. Many formats and visualization tools exist for displaying and manipulating the point cloud data.
DEM Digital Elevation Model is a three dimensional surface generated from the highest points in a point cloud. This emphasizes trees and man made structures.
DSM Digital Surface Model is a three dimensional surface generated from the lowest points in a point cloud. This emphasizes the contours of the landscape itself.
DTM Digital Terrain Model generally refers to the "ground truth" three dimensional surface model of an area. See the link in the Additional Information section for more details.
LAS Binary format for storing Lidar data and additional surface feature data that was created and maintained by the American Society for Photogrammetry and Remote Sensing ( ASPRS).
LAZ A zipped (compressed) version of a LAS file
XYZ A simple file format consisting of three floating point values for each data point in a point cloud
Photogrammetry The art and science of taking measurements from pictures. This has largely been supplanted by advances in Lidar technology but can also be used together with Lidar.
Lidar Originally, Lidar was a portmanteau of Light and Radar but that definition has changed over time. There is no currently generally accepted standard for what the word Lidar stands for or its exact capitalization. One common usage for Lidar is as an acronym for LIght Detection And Ranging. Acceptable capitalization forms include LiDAR, LIDAR and Lidar.